PODCAST: Providence Ranked Worst in State for Recycling
Wednesday, April 23, 2014
GoLocalProv News Team
Data released by the Rhode Island Resource Recovery Corporation (RIRRC) shows that for 2013, Providence had the lowest recycling rates in the state of Rhode Island. Ron and GolocalProv's Kate Nagle discuss.
Related Slideshow: RI Recycling Rates by Town - 2011 to 2013
 View Larger +
Prev
Next
#38. Providence
Rate of Overall Material Diversion
2013: 17.4%
2011: 18.2%
Mandatory Recycling Rate
2013: 16.9%
2011: 18.0%
MRF Recycling Rate
2013: 13.3%
2011: 14.6%
Tons of Trash Sent to Landfill Per Household
2013: 0.96
2011: 0.94
 View Larger +
Prev
Next
#37. Johnston
Rate of Overall Material Diversion
2013: 18.7%
2011: 18.7%
Mandatory Recycling Rate
2013: 18.4%
2011: 18.3%
MRF Recycling Rate
2013: 12.9%
2011: 12.2%
Tons of Trash Sent to Landfill Per Household
2013: 1.41
2011: N/A
 View Larger +
Prev
Next
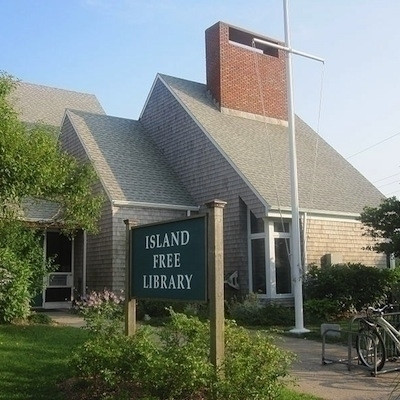
#36. New Shoreham
Rate of Overall Material Diversion
2013: 21.3%
2011: 46.4%
Mandatory Recycling Rate
2013: 20.8%
2011: 31.6%
MRF Recycling Rate
2013: 20.8%
2011: 23.1%
Tons of Trash Sent to Landfill Per Household
2013: N/A
2011: N/A
 View Larger +
Prev
Next
#35. Foster
Rate of Overall Material Diversion
2013: 23.8%
2011: 22.6%
Mandatory Recycling Rate
2013: 22.8%
2011: 21.7%
MRF Recycling Rate
2013: 22.7%
2011: 21.7%
Tons of Trash Sent to Landfill Per Household
2013: 1.07
2011: 1.15
 View Larger +
Prev
Next
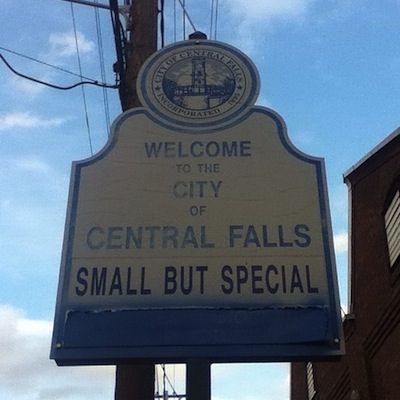
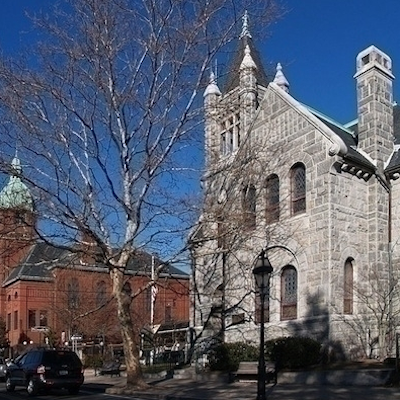
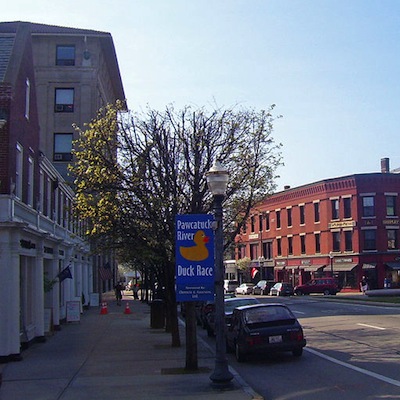
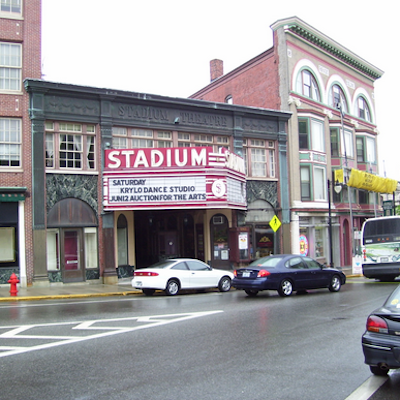
#34. Central Falls
Rate of Overall Material Diversion
2013: 25.0%
2011: 22.9%
Mandatory Recycling Rate
2013: 24.5%
2011: 22.4%
MRF Recycling Rate
2013: 22.2%
2011: 20.3%
Tons of Trash Sent to Landfill Per Household
2013: 0.82
2011: 0.72
 View Larger +
Prev
Next
#33. Warren
Rate of Overall Material Diversion
2013: 28.1%
2011: 40.2%
Mandatory Recycling Rate
2013: 27.4%
2011: 28.9%
MRF Recycling Rate
2013: 20.1%
2011: 25.2%
Tons of Trash Sent to Landfill Per Household
2013: 1.00
2011: 0.65
 View Larger +
Prev
Next
#32.Scituate
Rate of Overall Material Diversion
2013: 28.2%
2011: 25.3%
Mandatory Recycling Rate
2013: 27.8%
2011: 24.6%
MRF Recycling Rate
2013: 24.9%
2011: 22.1%
Tons of Trash Sent to Landfill Per Household
2013: 0.84
2011: 0.99
 View Larger +
Prev
Next
#31. Lincoln
Rate of Overall Material Diversion
2013: 28.7%
2011: 27.7%
Mandatory Recycling Rate
2013: 28.2%
2011: 27.8%
MRF Recycling Rate
2013: 22.4%
2011: 21.5%
Tons of Trash Sent to Landfill Per Household
2013: 1.17
2011: 1.23
 View Larger +
Prev
Next
#30. Pawtucket
Rate of Overall Material Diversion
2013: 28.7%
2011: 31.1%
Mandatory Recycling Rate
2013: 27.7%
2011: 27.6%
MRF Recycling Rate
2013: 21.2%
2011: 20.0%
Tons of Trash Sent to Landfill Per Household
2013: 0.58
2011: 0.61
 View Larger +
Prev
Next
#29. Cumberland
Rate of Overall Material Diversion
2013: 29.2%
2011: 36.4%
Mandatory Recycling Rate
2013: 28.8%
2011: 36.2%
MRF Recycling Rate
2013: 23.6%
2011: 19.9%
Tons of Trash Sent to Landfill Per Household
2013: 0.95
2011: 1.20
 View Larger +
Prev
Next
#28. Little Compton
Rate of Overall Material Diversion
2013: 29.5%
2011: 36.5%
Mandatory Recycling Rate
2013: 28.1%
2011: 30.9%
MRF Recycling Rate
2013: 28.1%
2011: 26.7%
Tons of Trash Sent to Landfill Per Household
2013: 0.73
2011: 1.08
 View Larger +
Prev
Next
#27. Coventry
Rate of Overall Material Diversion
2013: 31.6%
2011: 30.7%
Mandatory Recycling Rate
2013: 31.4%
2011: 30.3%
MRF Recycling Rate
2013: 22.7%
2011: 21.5%
Tons of Trash Sent to Landfill Per Household
2013: 1.03
2011: 1.06
 View Larger +
Prev
Next
#26. West Warwick
Rate of Overall Material Diversion
2013: 32.2%
2011: 31.4%
Mandatory Recycling Rate
2013: 31.7%
2011: 31.1%
MRF Recycling Rate
2013: 20.5%
2011: 21.0%
Tons of Trash Sent to Landfill Per Household
2013: 0.92
2011: 0.96
 View Larger +
Prev
Next
#25. West Greenwich
Rate of Overall Material Diversion
2013: 32.5%
2011: 26.1%
Mandatory Recycling Rate
2013: 31.0%
2011: 24.6%
MRF Recycling Rate
2013: 26.6%
2011: 20.6%
Tons of Trash Sent to Landfill Per Household
2013: 1.20
2011: 1.51
 View Larger +
Prev
Next
#24. Tiverton
Rate of Overall Material Diversion
2013: 33.3%
2011: 54.9%
Mandatory Recycling Rate
2013: 32.6%
2011: 54.6%
MRF Recycling Rate
2013: 29.2%
2011: 28.5%
Tons of Trash Sent to Landfill Per Household
2013: 0.75
2011: 1.03
 View Larger +
Prev
Next
#23. North Providence
Rate of Overall Material Diversion
2013: 33.7%
2011: 28.5%
Mandatory Recycling Rate
2013: 33.1%
2011: 27.8%
MRF Recycling Rate
2013: 23.4%
2011: 21.4%
Tons of Trash Sent to Landfill Per Household
2013: 0.77
2011: 0.89
 View Larger +
Prev
Next
#22. Westerly/Hopkinton
Rate of Overall Material Diversion
2013: 33.8%
2011: 35.3%
Mandatory Recycling Rate
2013: 32.3%
2011: 24.0%
MRF Recycling Rate
2013: 21.0%
2011: 15.3%
Tons of Trash Sent to Landfill Per Household
2013: 1.43
2011: 1.64
View Larger +
Prev
Next
#21. Jamestown
Rate of Overall Material Diversion
2013: 33.9%
2011: 28.1%
Mandatory Recycling Rate
2013: 33.1%
2011: 27.4%
MRF Recycling Rate
2013: 30.6%
2011: 25.9%
Tons of Trash Sent to Landfill Per Household
2013: 2.23
2011: 2.24
 View Larger +
Prev
Next
#20. Woonsocket
Rate of Overall Material Diversion
2013: 34.0%
2011: 33.0%
Mandatory Recycling Rate
2013: 32.2%
2011: 31.6%
MRF Recycling Rate
2013: 24.6%
2011: 23.7%
Tons of Trash Sent to Landfill Per Household
2013: 0.86
2011: 0.88
 View Larger +
Prev
Next
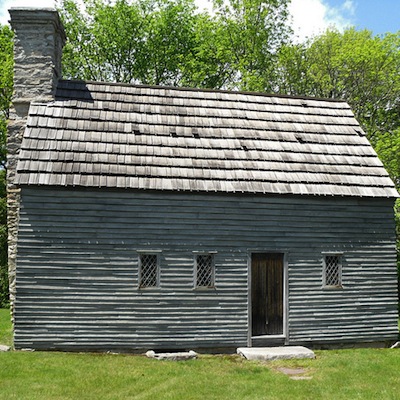
#19. Exeter
Rate of Overall Material Diversion
2013: 34.0%
2011: 33.0%
Mandatory Recycling Rate
2013: 32.2%
2011: 31.6%
MRF Recycling Rate
2013: 24.6%
2011: 23.7%
Tons of Trash Sent to Landfill Per Household
2013: 0.86
2011: 0.88
 View Larger +
Prev
Next
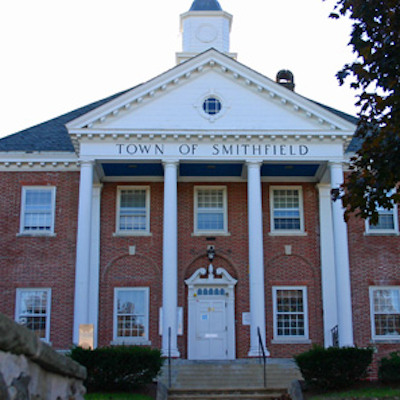
#18. Smithfield
Rate of Overall Material Diversion
2013: 35.7%
2011: 38.4%
Mandatory Recycling Rate
2013: 35.4%
2011: 38.0%
MRF Recycling Rate
2013: 26.7%
2011: 24.8%
Tons of Trash Sent to Landfill Per Household
2013: 0.87
2011: 0.72
 View Larger +
Prev
Next
#17. Glocester
Rate of Overall Material Diversion
2013: 36.2%
2011: 36.8%
Mandatory Recycling Rate
2013: 33.6%
2011: 34.4%
MRF Recycling Rate
2013: 33.6%
2011: 31.1%
Tons of Trash Sent to Landfill Per Household
2013: 0.78
2011: 0.86
 View Larger +
Prev
Next
#16. Newport
Rate of Overall Material Diversion
2013: 37.6%
2011: 36.0%
Mandatory Recycling Rate
2013: 37.2%
2011: 35.7%
MRF Recycling Rate
2013: 23.6%
2011: 22.9%
Tons of Trash Sent to Landfill Per Household
2013: 0.74
2011: 0.92
 View Larger +
Prev
Next
#15. Cranston
Rate of Overall Material Diversion
2013: 37.7%
2011: 36.0%
Mandatory Recycling Rate
2013: 36.9%
2011: 35.7%
MRF Recycling Rate
2013: 24.3%
2011: 22.4%
Tons of Trash Sent to Landfill Per Household
2013: 0.83
2011: 0.88
 View Larger +
Prev
Next
#14. Richmond
Rate of Overall Material Diversion
2013: 38.0%
2011: 24.7%
Mandatory Recycling Rate
2013: 37.1%
2011: 23.3%
MRF Recycling Rate
2013: 37.1%
2011: 23.3%
Tons of Trash Sent to Landfill Per Household
2013: N/A
2011: N/A
 View Larger +
Prev
Next
#13. Bristol
Rate of Overall Material Diversion
2013: 38.2%
2011: 23.5%
Mandatory Recycling Rate
2013: 37.7%
2011: 17.7%
MRF Recycling Rate
2013: 17.4%
2011: 17.7%
Tons of Trash Sent to Landfill Per Household
2013: 1.32
2011: N/A
 View Larger +
Prev
Next
#12. Burrillville
Rate of Overall Material Diversion
2013: 38.3%
2011: 30.2%
Mandatory Recycling Rate
2013: 36.7%
2011: 28.9%
MRF Recycling Rate
2013: 31.4%
2011: 22.6%
Tons of Trash Sent to Landfill Per Household
2013: 0.70
2011: 0.83
 View Larger +
Prev
Next
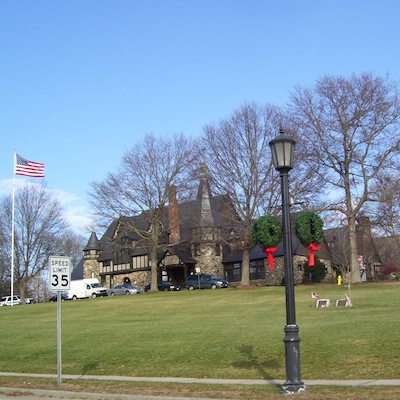
#11. North Smithfield
Rate of Overall Material Diversion
2013: 38.5%
2011: 37.2%
Mandatory Recycling Rate
2013: 37.8%
2011: 36.6%
MRF Recycling Rate
2013: 31.9%
2011: 30.6%
Tons of Trash Sent to Landfill Per Household
2013: 0.76
2011: 0.81
 View Larger +
Prev
Next
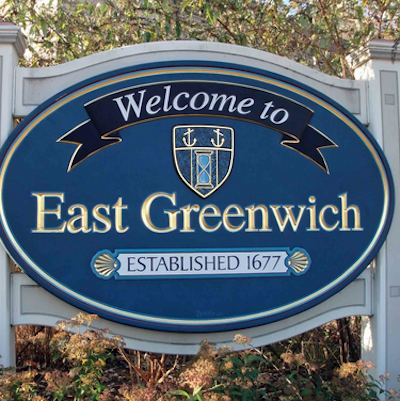
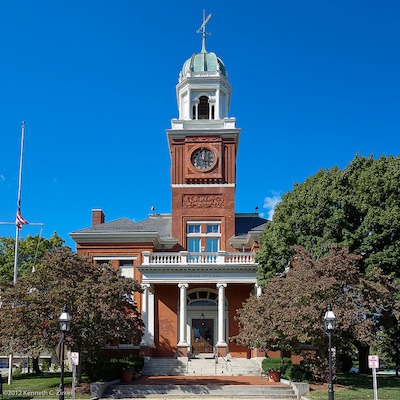
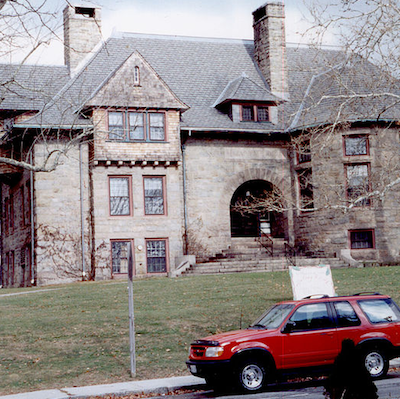
#10. East Greenwich
Rate of Overall Material Diversion
2013: 39.4%
2011: 38.2%
Mandatory Recycling Rate
2013: 39.2%
2011: 36.5%
MRF Recyling Rate
2013: 29.4%
2011: 28.5%
Tons of Trash Sent to Landfill Per Household
2013: 0.98
2011: 1.02
 View Larger +
Prev
Next
#9. Narragansett
Rate of Overall Material Diversion
2013: 39.5%
2011: 42.3%
Mandatory Recycling Rate
2013: 36.9%
2011: 22.8%
MRF Recycling Rate
2013: 36.9%
2011: 16.9%
Tons of Trash Sent to Landfill Per Household
2013: 0.37
2011: N/A
 View Larger +
Prev
Next
#8. Charlestown
Rate of Overall Material Diversion
2013: 42.6%
2011: 44.1%
Mandatory Recycling Rate
2013: 40.3%
2011: 42.4%
MRF Recycling Rate
2013: 33.6%
2011: 33.6%
Tons of Trash Sent to Landfill Per Household
2013: 0.42
2011: 0.41
 View Larger +
Prev
Next
#7. North Kingstown
Rate of Overall Material Diversion
2013: 43.4%
2011: 36.4%
Mandatory Recycling Rate
2013: 41.5%
2011: 33.5%
MRF Recycling Rate
2013: 41.5%
2011:29.4%
Tons of Trash Sent to Landfill Per Household
2013: 1.11
2011: 1.32
 View Larger +
Prev
Next
#6. East Providence
Rate of Overall Material Diversion
2013: 47.8%
2011: 48.5%
Mandatory Recycling Rate
2013: 47.5%
2011: 48.2%
MRF Recycling Rate
2013: 26.2%
2011:24.7%
Tons of Trash Sent to Landfill Per Household
2013: 0.82
2011: 0.83
 View Larger +
Prev
Next
#5. Warwick
Rate of Overall Material Diversion
2013: 49.3%
2011: 46.3%
Mandatory Recycling Rate
2013: 49.1%
2011: 46.1%
MRF Recycling Rate
2013: 29.3%
2011:26.0%
Tons of Trash Sent to Landfill Per Household
2013: 0.87
2011: 0.93
 View Larger +
Prev
Next
#4. Portsmouth
Rate of Overall Material Diversion
2013: 50.0%
2011: 44.2%
Mandatory Recycling Rate
2013: 45.0%
2011: 40.3%
MRF Recycling Rate
2013: 45.0%
2011:30.0%
Tons of Trash Sent to Landfill Per Household
2013: 0.95
2011: 1.07
 View Larger +
Prev
Next
#3. Barrington
Rate of Overall Material Diversion
2013: 50.9%
2011: 49.3%
Mandatory Recycling Rate
2013: 50.6%
2011: 48.6%
MRF Recycling Rate
2013: 29.4%
2011: 27.1%
Tons of Trash Sent to Landfill Per Household
2013: 0.97
2011: 0.97
 View Larger +
Prev
Next
#2. Middletown
Rate of Overall Material Diversion
2013: 54.1%
2011: 53.5%
Mandatory Recycling Rate
2013: 53.7%
2011: 52.3%
MRF Recycling Rate
2013: 41.9%
2011: 40.8%
Tons of Trash Sent to Landfill Per Household
2013: 0.55
2011: 0.56
 View Larger +
Prev
Next
#1. South Kingstown
Rate of Overall Material Diversion
2013: 54.5%
2011: 63.1%
Mandatory Recycling Rate
2013: 51.4%
2011: 50.6%
MRF Recycling Rate
2013: 40.0%
2011: 42.4%
Tons of Trash Sent to Landfill Per Household
2013: 0.39
2011 :0.42
Related Articles
Enjoy this post? Share it with others.