
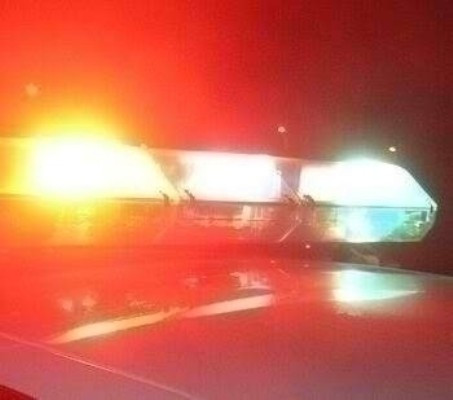
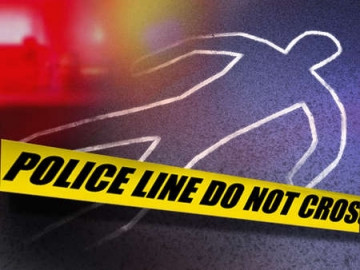
Driving While Black: The Communities Where You’re Most Likely to Be Stopped
Thursday, October 16, 2014
Black, Hispanic, and other non-white drivers are more likely to be pulled over than white drivers in two thirds of Rhode Island communities, according to a new report issued by the Institute on Race and Justice at Northeastern University.
The report, based on traffic stop data between January 2013 and May 2014, shows that the percentage of non-white drivers pulled over exceeded their share of their local driving population in 29 communities across the state.
“To me, two thirds is a large part of Rhode Island and it suggests a problem,” said Jim Vincent, president of the Providence branch of the NAACP. “I’m just saddened by the fact that racial profiling seemingly persists in Rhode Island.”
GET THE LATEST BREAKING NEWS HERE -- SIGN UP FOR GOLOCAL FREE DAILY EBLASTProvidence tops the list, with 24.1 percent more non-white drivers than would be expected based on how many non-whites make up the local driving population. The disparity spans communities of all demographics in Rhode Island. Second after Providence is North Smithfield, where 21.7 percent more non-white drivers were stopped than would be expected. Cranston was third at 17.1 percent.
Overall, six communities had disparities of 10 percent or more. The other three were, in order: North Providence, Lincoln, and Johnston.
“Despite claims of improvement, the latest study of traffic stop data in Rhode Island presents the same old story: in most communities, racial minorities, as a percentage of the driving population, remain more likely than whites to be stopped by police,” said Steve Brown, executive director of the Rhode Island ACLU.
Since the institute first studied the issue, the disparity has widened in a number of communities.
In Providence, the racial disparity in traffic stops was 22.1 percent a decade ago. In North Smithfield it was 15.8 percent.
“And once again we learn that, once stopped, racial minorities in most communities are more likely to be subject to discretionary searches, but less likely to be found with contraband. Every study conducted in Rhode Island, since the first one over a decade ago, has reached these same conclusions,” Brown added.
Non-white drivers are also less likely to receive a traffic citation after a stop. Yet they are also nearly twice as likely to be arrested after a traffic stop as white drivers, according the report, which was released yesterday.
Little pressure on police to reform
Many civil liberties advocates faulted the report for failing to urge meaningful reform.
“At this point, asking police departments to more carefully examine the data rather than take concrete steps provides little solace to those who bear the brunt of questionable traffic stops and searches every day. The passage of strong and comprehensive legislation designed to address the problem of racial profiling will not solve this deeply-entrenched problem, but it would go a long ways towards addressing it and confronting the legitimate grievances of the minority community,” Brown said.
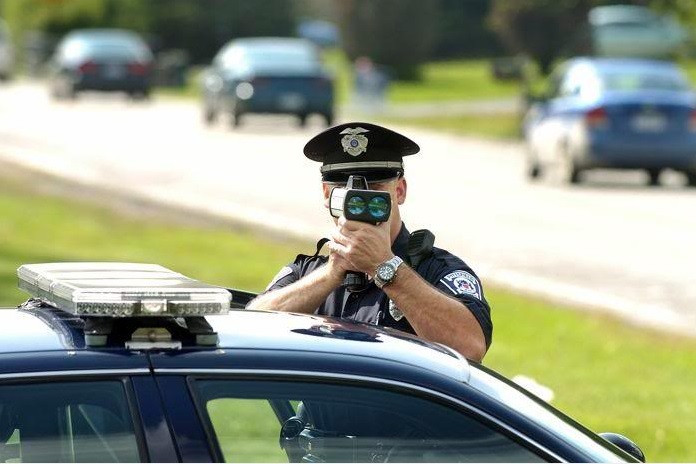
As a general rule, a police officer can pull over a car for a traffic violation or a reasonable suspicion of criminal activity, according to several attorneys interviewed by GoLocalProv. Fred Ordonez, executive director of Direct Action for Rights and Equality, said his group has been among those pushing for a new state law that would raise the standard from reasonable suspicion to the higher standard of probable cause—which is used to for arrests, searches, and seizures.
At the very least, Ordonez said police officers should document the reasonable suspicion that led them to make the stop. But the Rhode Island State Police Chiefs Association has blocked passage of the law. “They want zero reason and zero reason could very likely be the color of their skin,” Ordonez said.
Bob Craven, a North Kingstown state rep and former state prosecutor, said he could understand why the data is upsetting. “There’s a great loss of dignity when you’re approached by a police officer like that,” Craven said. “Yes, it’s not appropriate. It’s against the law.”
City councilman says he has been stopped repeatedly over racial prejudice
Racial prejudices can even affect white drivers in unexpected ways, according to Providence Councilman Kevin Jackson, who said his job as a social worker often has him driving high-school age black and Hispanic males back to their homes in minority neighborhoods. He’s been stopped three times in the last year during such trips.
He knows the stops are racially-motivated because of the “unbelievable” excuses given by officers. Once, an officer told him he pulled him over because of a leaf on his windshield. “It wasn’t even a full leaf,” Jackson said.

He has even been pulled over on North Main Street, in the general area of the Mount Hope neighborhood he represents. Jackson had a black co-worker and a young black male as passengers.
Craven remained confident that any citations stemming from such incidents would never get very far in court, and probably wouldn’t even pass a preliminary review by a prosecutor. An officer, he said, must be able to articulate in detail the basis for his reasonable suspicion. “There’s got to be more beef in the sandwich than, ‘He looked nervous and he looked away,’” Craven said.
Jackson says he was not cited for any traffic violations and was let go each time was the officers recognized his name on his driver’s license. Jackson says he also saw the disparity affect his two adopted sons, who are of African-American descent. “We know there’s racial profiling going on,” Jackson said. “There’s no other way to say it and I’ve experienced it.”
Jackson is one of several council members—the others include Luis Aponte and Sabina Matos—who earlier this year introduced an ordinance to combat racial profiling in the Providence Police Department. That measure remains bottled up in committee, something Jackson blames on its strong language and the fact that the administration was not included in drafting it.
Jackson says the ordinance is just meant to be a starting point for a frank discussion on race and local policing. He says the city needs to have a community-wide discussion about prejudice and attitudes towards those in poverty. “I think a lot of people don’t want to have that conversation,” he said.
“Until we look each other eye to eye and discuss this, we’re just going to keep going back and forth,” he added.
NAACP leader recommends body cameras
Vincent told GoLocalProv he shared the disappointment in the tepid and vague recommendations offered in the report. One solution he advocates is body cameras—something he says police departments that can afford to buy military-style equipment should be able to acquire. “If you can afford to do that you certainly can afford to buy body cameras,” Vincent said.
Vincent said body cameras would build community confidence in local law enforcement. When police have a relationship based on trust the residents they are protecting and serving, it is easier to fight local crime, Vincent added, which is why he wonders why any agency would oppose body cameras.
GoLocalProv made repeated efforts to obtain comment from top three police departments identified in the study: Providence, North Smithfield, and Cranston. Messages left for senior officers in all three departments went unreturned yesterday. So were requests for comment from Providence Mayor Angel Taveras and Cranston Mayor Allan Fung.
Related Slideshow: The Communities with the Greatest Racial Disparities in Traffic Stops
The below slides show the racial disparities in traffic stops, ranking communities from least to greatest. For each community, the total number of stops is shown, along with the percentage of non-white drivers compared to the number of non-white drivers who are stopped. A racial disparity appears when the percentage of non-white drivers stopped exceeds the percentage of drivers who are non-white. Data is from a newly released report from the Institute on Race and Justice at Northeastern University. Data was collected by local law enforcement for traffic stops between January 2013 and May 2014. Note: Exeter and Block Island are not included in the report.

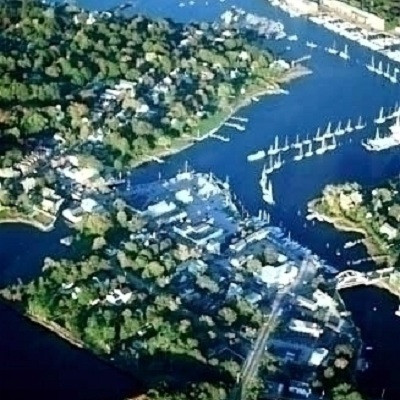


#37 Barrington
#36 West Greenwich
#35 Westerly
#34 Central Falls
#33 Bristol
#32 Coventry
#31 North Kingstown
#30 Warwick
#29 Burrillville
#28 East Greenwich
#27 East Providence
#26 Tiverton
#25 South Kingstown
#24 Little Compton
#23 Richmond
#22 Portsmouth
#19 Charlestown
#20 Narragansett
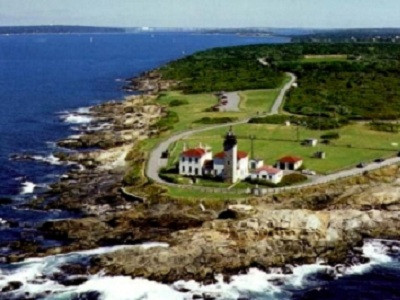
#19 Newport
#18 Glocester
#17 Scituate
#16 Smithfield
#15 Jamestown
#14 Warren
#13 Middletown
#12 Woonsocket
#11 Hopkinton
#10 West Warwick
#9 Cumberland
#8 Foster
#7 Pawtucket
#6 Johnston
#5 Lincoln
#4 North Providence
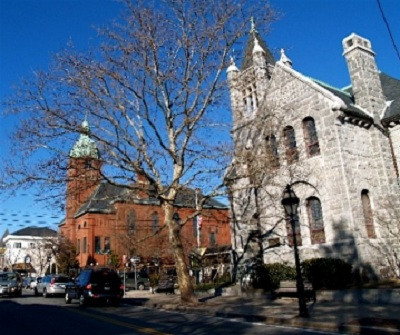
#3 Cranston
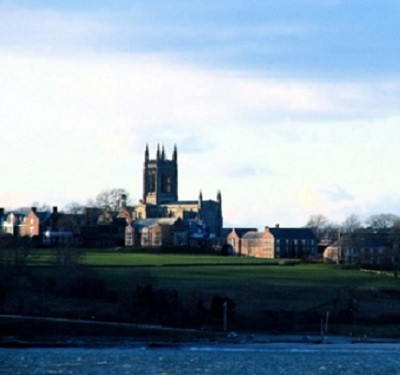
#2 North Smithfield
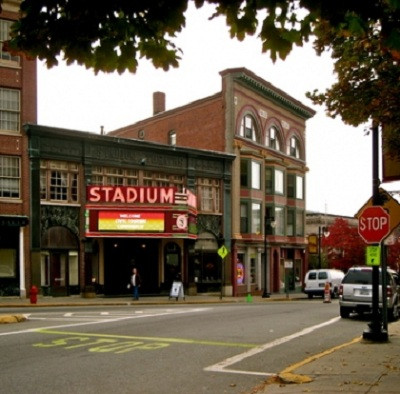
#1 Providence
Related Articles
- Brown Research: Racial Bias in Nursing Homes
- NEW: Groups to March in Support of Racial Profiling Prevention Bill
- Study Finds Racial Gaps Putting RI’s Economy, Future at Risk
- NEW: Groups Slam Police Chiefs for Opposing Racial Profiling Bill
- NEW: Lawmakers Unveil Racial Profiling Bill
- Ugly incident at Providence goes way beyond racial tension
- Racial Profiling Bill Stalled in Committee
- NEW: Marijuana Arrest Rates Racially Disparate Toward Blacks
- The Communities with the Greatest Racial Disparities in Traffic Stops
- State Report: Racial Profiling, Teacher Evaluations + Food Labels
- Group Accuses RI Schools of Racial Profiling
- Nicole Haslinger: Zimmerman + Racial Profiling in Rhode Island
