
video: Johnston Blocks Black Church Says Reverend, City Official Calls Him “F___ing Black Owner”
Tuesday, November 24, 2015
In a video tape exclusively obtained by GoLocalProv, a Johnston town official is heard making a racially charged statement regarding a church pastor’s attempts to rehabilitate a historic church in town — and the reverend is calling the town’s treatment of his efforts racist. (Starting at the 2:25 mark of the video)

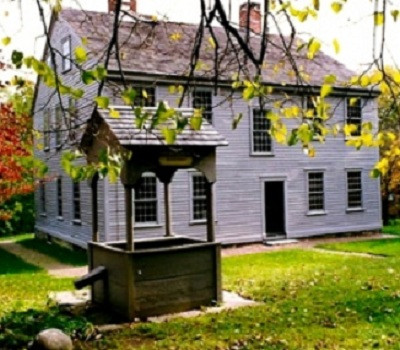
In a meeting with his supervisor and the contractor on the project that was taped, Johnston building inspector Ben Nascenzi can be heard referring to Reverend Dr. Chris Abhulime as “the fucking black owner” of the former historic Belknap Church.
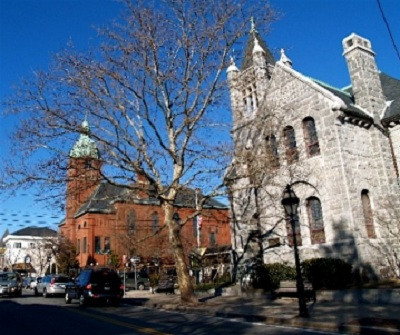
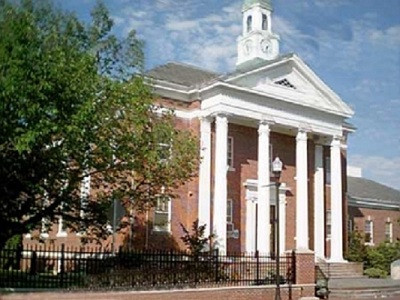
Abhulime, who is a Reverend at King’s Tabernacle in Providence, told GoLocal that since purchasing the former Belknap Church on 500 Greenville Avenue in Johnston this past spring, that he as been stopped in his attempts to rehabilitate the property, “I believe we are dealing with racism with the officials at the town, with the neighbors as well, and we’re being treated differently,” said Abhulime. “They’re stonewalling, maybe they have other plans for the land. But they clearly don’t want us there.”
GET THE LATEST BREAKING NEWS HERE -- SIGN UP FOR GOLOCAL FREE DAILY EBLAST“We have been able to do some work, but we’ve been fighting tooth and nail,” said Abhulime of the church’s efforts to expand. “I’ve pulled permits before, and never had this happen.”
Abhulime, who is a lab supervisor at Genzyme and formerly worked at Amgen after his getting his Masters Degree from URI, said that be believes he and his church are being subject to racism.
Efforts Thwarted

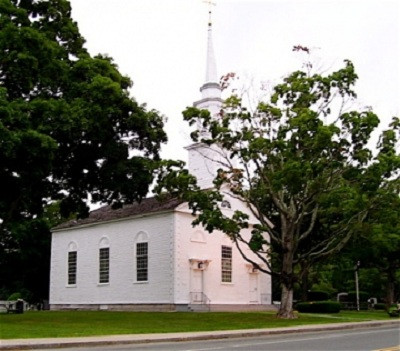
“It started when we decided to purchase a previous church that had been there for a hundred years,” said Abhulime. “So we made and offer back in the spring, we then we were subject to zoning approval.”
“So then we applied for zoning to use it for a church — we had an attorney and surveyor, we submitted the application, and they gave us an appointment for June 25,” said Abhulime. “We paid the fees, the attorney, the surveyor. At the meeting, there appeared to be plenty of time, there were people ahead of us had good conversation with the zoning officials, so when it came our time, it didn’t seem like there’d be an issue.”
“But then it became obvious they were going to deny us. It only lasted 4-5 minutes, and they didn’t tell us why it was denied,” said Abhulime. “Most of what they said was, “Are you done, are you done?” The neighbors had an attorney, who wanted to make a statement — but they didn’t even give him a chance. So we had to go back and figure out what just happened — that’s not how a hearing should be held. We paid quite a lot just to get dismissed just within five minutes. We were treated unjustly.”
Abhulime said that there is an appeal to the zoning decision currently at Superior Court.
“So we went ahead and purchased it,” said Abhulime. “We bought it on a Thursday and on Sunday I told my parishioners about it, and we went to look. The next Monday, the building official and asked me why I brought so many cars, so many black people, and said he authorized the police to act if we went back. They said we had a service, which I wouldn’t have done. We have money — I would never have had a service in a dilapidated property. But it’s out property, we purchased it, we can go see it.”
“The one a ‘building condemned’ sign appeared on the front, unbeknownst to me,” said Abhulime. “I called the official, who wouldn’t return my calls. I read up on the law, he was supposed to give us the heads up, give unreasonable time to address it. One of my church elders asked to go over there to have someone look at the roof, and the police were there, saying they got a call that people were in the building.”
“With everything playing out nationally, I said let’s allow some breathing space,” said Abhulime. “But we purchased the building. We purchased it for $75,000. I told my attorney — we can’t just buy a building and then not be told anything.”

Abhulime said he continued to have issues with the town, including have the inspector come and say what trees they could — or couldn’t — cut. “There are no significant trees on the property,” said Abhulime.
“So then we got a contractor for the roof — it was leaking. He was given so much trouble. They wouldn’t give us a permit, asking for a lead inspection, asbestos — what does that have do with roof? They couldn’t get rid of us through zoning, now they’re making it hard," said Abhulime. "So I told my contractors, when you’re dealing with the town, have your phone on, an have it on record.”
Abhulime said he decided to go public with the video when he had exhausted his options.
“I contacted Jim Vincent with the NAACP to try and intervene, but he’s not getting anywhere with the city, either,” said Abhulime. " I told him we’re being treated differently — we just need someone to speak for us. Maybe others went through the same thing. The way we’ve been treated is not right."
EDITOR'S NOTE: GoLocal has allowed swear words to be printed when we thought it was imperative to the journalism. Upon occasion we have published columns and news articles that contained quotes with swear words.
THIS ARTICLE WAS ORIGINALLY PUBLISHED AT 1:05 PM on NOVEMBER 23, 2015.
Related Slideshow: The Communities with the Greatest Racial Disparities in Traffic Stops
The below slides show the racial disparities in traffic stops, ranking communities from least to greatest. For each community, the total number of stops is shown, along with the percentage of non-white drivers compared to the number of non-white drivers who are stopped. A racial disparity appears when the percentage of non-white drivers stopped exceeds the percentage of drivers who are non-white. Data is from a newly released report from the Institute on Race and Justice at Northeastern University. Data was collected by local law enforcement for traffic stops between January 2013 and May 2014. Note: Exeter and Block Island are not included in the report.


#37 Barrington
#36 West Greenwich
#35 Westerly
#34 Central Falls
#33 Bristol
#32 Coventry
#31 North Kingstown
#30 Warwick
#29 Burrillville
#28 East Greenwich
#27 East Providence
#26 Tiverton
#25 South Kingstown
#24 Little Compton
#23 Richmond
#22 Portsmouth
#19 Charlestown
#20 Narragansett
#19 Newport
#18 Glocester
#17 Scituate
#16 Smithfield
#15 Jamestown
#14 Warren
#13 Middletown
#12 Woonsocket
#11 Hopkinton
#10 West Warwick
#9 Cumberland
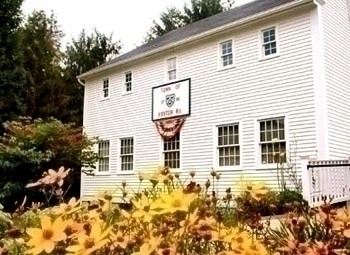
#8 Foster
#7 Pawtucket
#6 Johnston
#5 Lincoln
#4 North Providence
#3 Cranston
#2 North Smithfield
#1 Providence
Related Articles
- NEW: BlackLivesMatter to Protest on Federal Hill Over Columbus Day
- Finneran: It’s a Black Thing, You Wouldn’t Understand
- #BlackLivesMatter Supporters Protest at Federal Hill Dunkin’ Donuts
- Rally for Black Major in Providence Police Department at City Hall Today
- EXCLUSIVE: Dunkin’ Donuts Worker Writes ‘#BlackLivesMatter’ on Police Officer’s Cup
- NEW: Dunkin’ Donuts Corporate Responds to GoLocal Report on #BlackLivesMatter, Prov Police
- Rhode Island’s Diversity Explosion—See Where
- GoLocalProv’s Nagle Wins NAACP Award for Diversity Coverage - 3rd Major Award in 2014
- GoLocalProv Wins Metcalf Award for Diversity in Media
- Rhode Island Reacts to School Diversity Report
- PHOTOS: 26th Annual Metcalf Awards for Diversity in the Media
- It’s All About Education: Do We Really Value Diversity in Schools?
- NEW: RI Gubernatorial Candidates to Appear at Diversity Forum
